Vector Visualization: Seeing Embeddings in 3D Space with PCA
Introduction
Vector embeddings are the foundation of modern AI systems such as semantic search, recommendation engines, Retrieval-Augmented Generation (RAG), clustering, and similarity matching.
But one common challenge exists:
Vectors are powerful, but invisible.
Embeddings usually contain hundreds or thousands of dimensions, making them difficult to understand directly. We can measure cosine similarity or Euclidean distance, but it is hard to see why one vector is closer than another.
That is where Vector Visualization comes in.
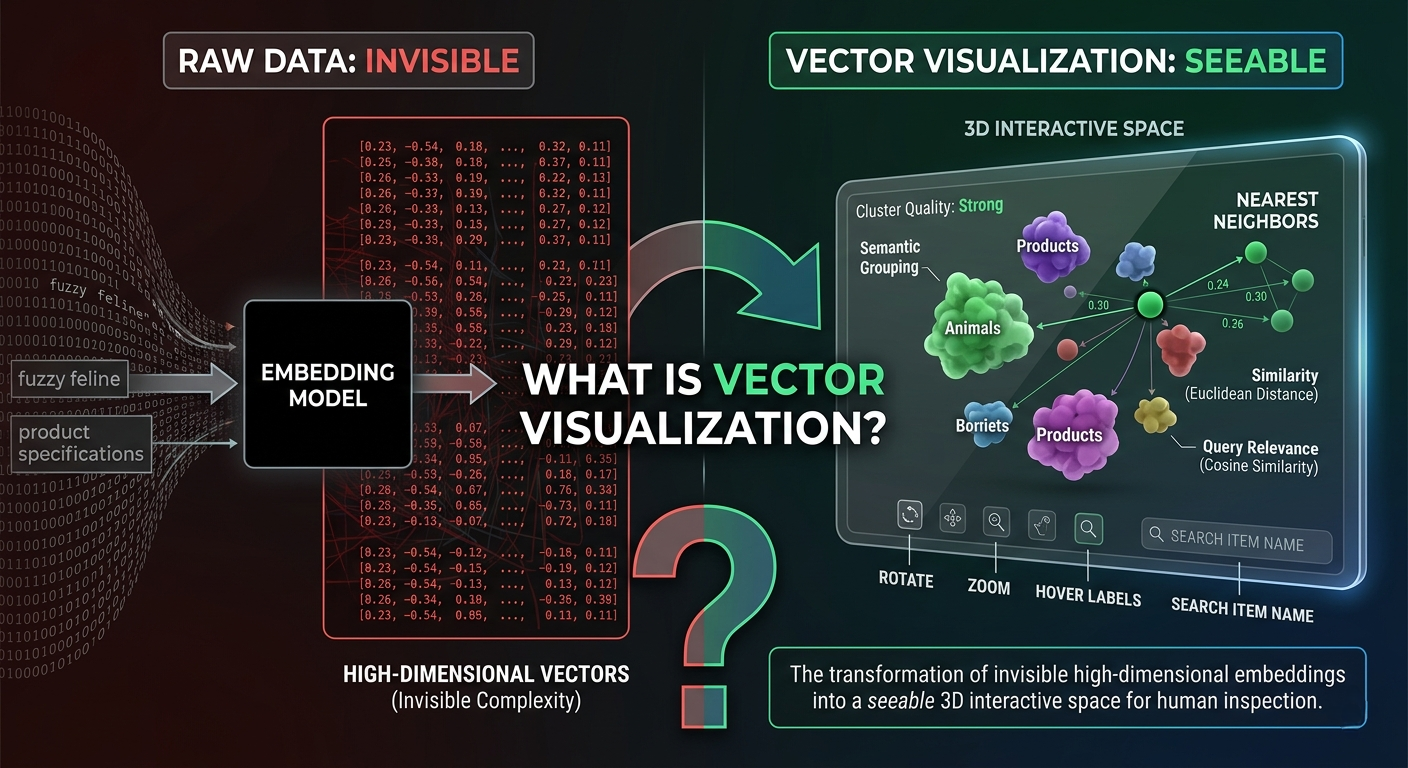
What is Vector Visualization?
Vector Visualization is a concept where high-dimensional embeddings are transformed into a 3D interactive space so humans can visually inspect:
- Similarity between vectors
- Cluster quality
- Semantic grouping
- Query relevance
- Outliers and noise
- Embedding model performance
This makes vector databases and embedding systems far more interpretable.
Core Idea
Suppose we have embeddings like:
- Product descriptions
- User queries
- Documents
- Images
- Categories
Each item is converted into a vector such as:
[0.23, -0.54, 0.92, ..., 0.11]These vectors may contain 384, 768, or 1536 dimensions.
Humans cannot visualize that directly.
So we apply:
PCA (Principal Component Analysis)
PCA reduces high-dimensional vectors into lower dimensions while preserving maximum variance.
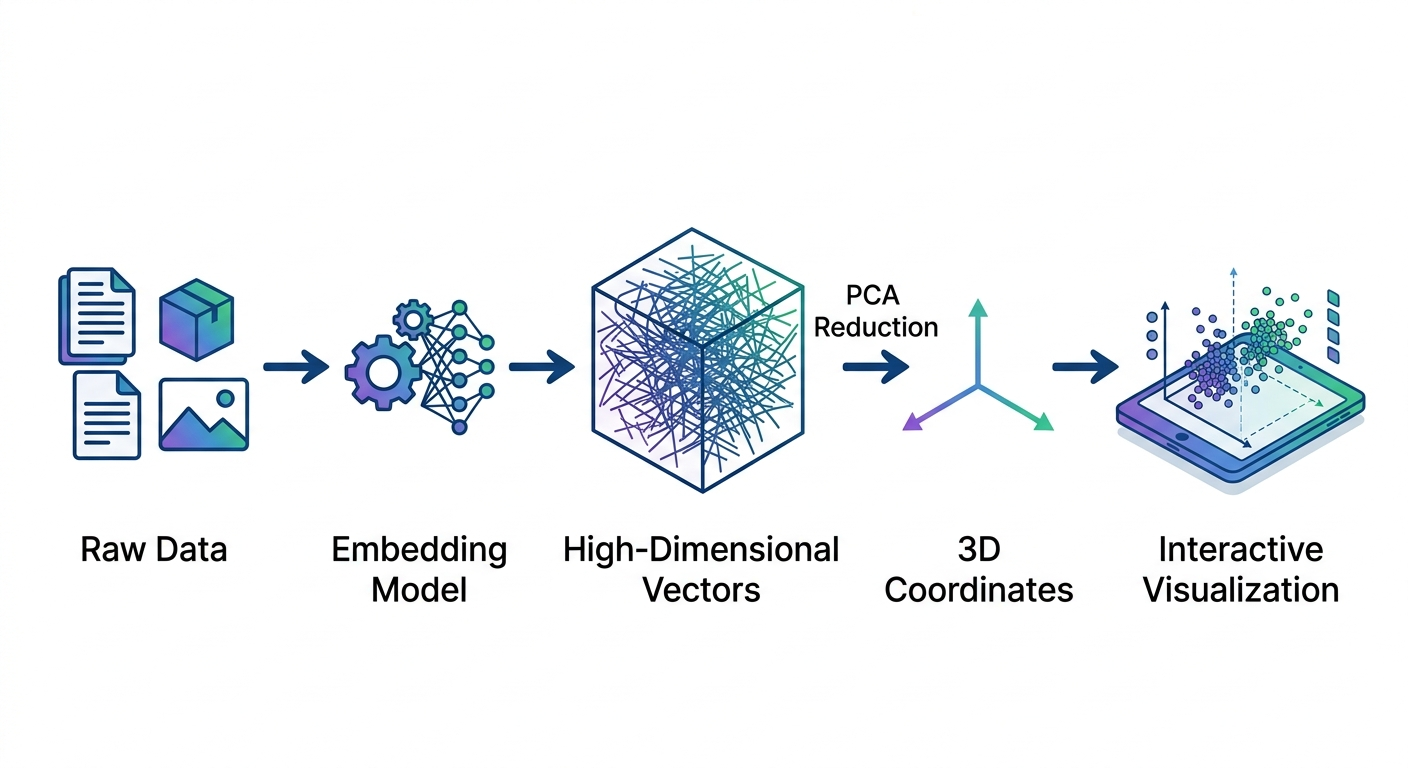
We convert:
1536 Dimensions → 3 DimensionsThen we plot:
X Axis = Principal Component 1
Y Axis = Principal Component 2
Z Axis = Principal Component 3
Now embeddings become visible points in 3D space.
Visualization Workflow
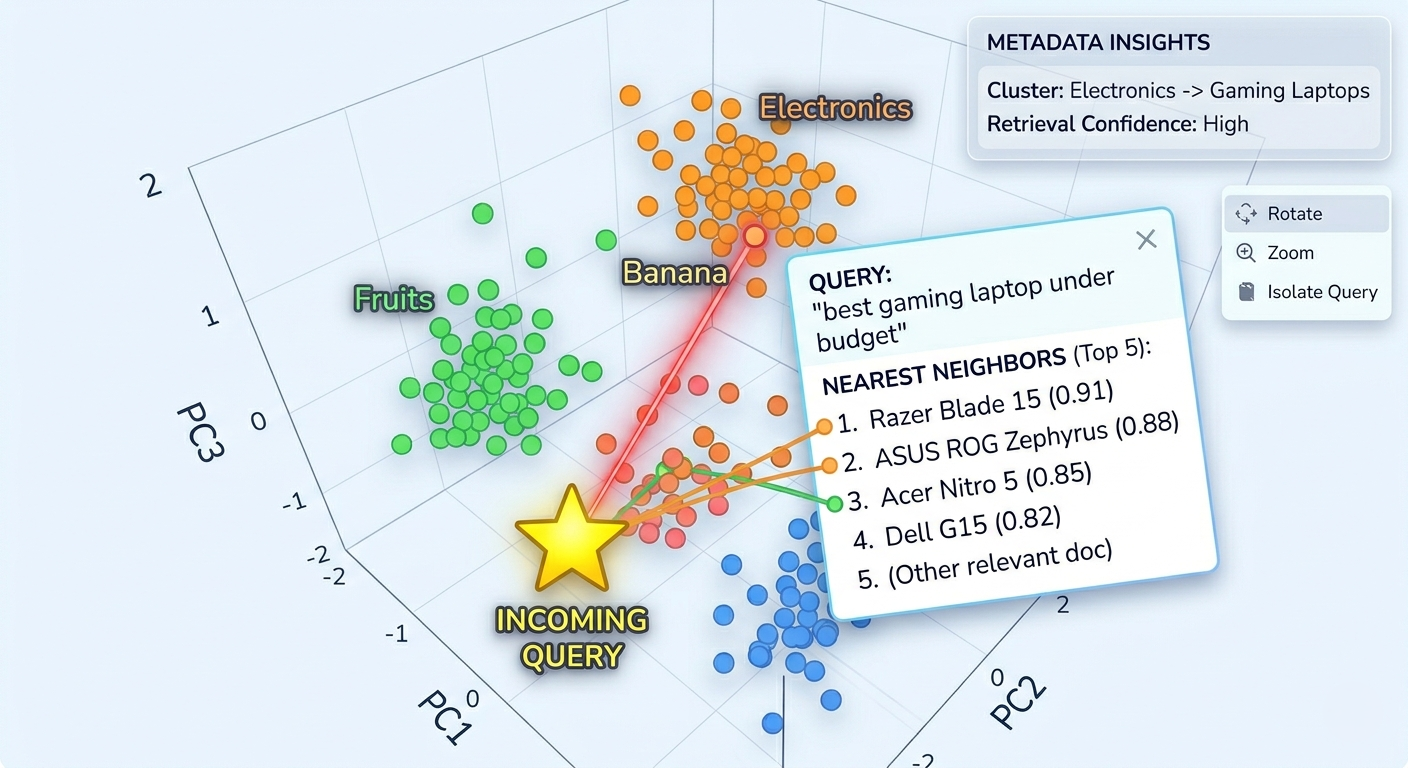
Raw Data
   ↓
Embedding Model
   ↓
High-Dimensional Vectors
   ↓
PCA Reduction
   ↓
3D Coordinates
   ↓
Interactive Visualization
Incoming Query Visualization
The most powerful feature is plotting the incoming user query inside the same 3D vector space.
Example:
User searches:
best gaming laptop under budgetThis query is converted into an embedding and placed in the graph.
Now you can instantly see:
- Which products are nearest
- Which cluster it belongs to
- Why certain results were retrieved
- Whether embedding quality is strong or weak
Why This Matters
1. Compare Embedding Models
You can compare multiple models like:
- OpenAI Embeddings
- BGE
- E5
- Sentence Transformers
- Custom Models
Check which one creates better clustering.
2. Debug Search Results
If irrelevant documents are near the query point:
- Bad chunking
- Poor embeddings
- Incorrect metadata
- Noise in training data
3. Detect Outliers
Random vectors far away from clusters often indicate:
- Corrupt data
- Wrong labels
- Duplicate noise
- Embedding issues
4. Improve RAG Systems
For Retrieval-Augmented Generation:
- Query should land near relevant chunks
- If not, retrieval quality is weak
Visualization exposes this instantly.
Example
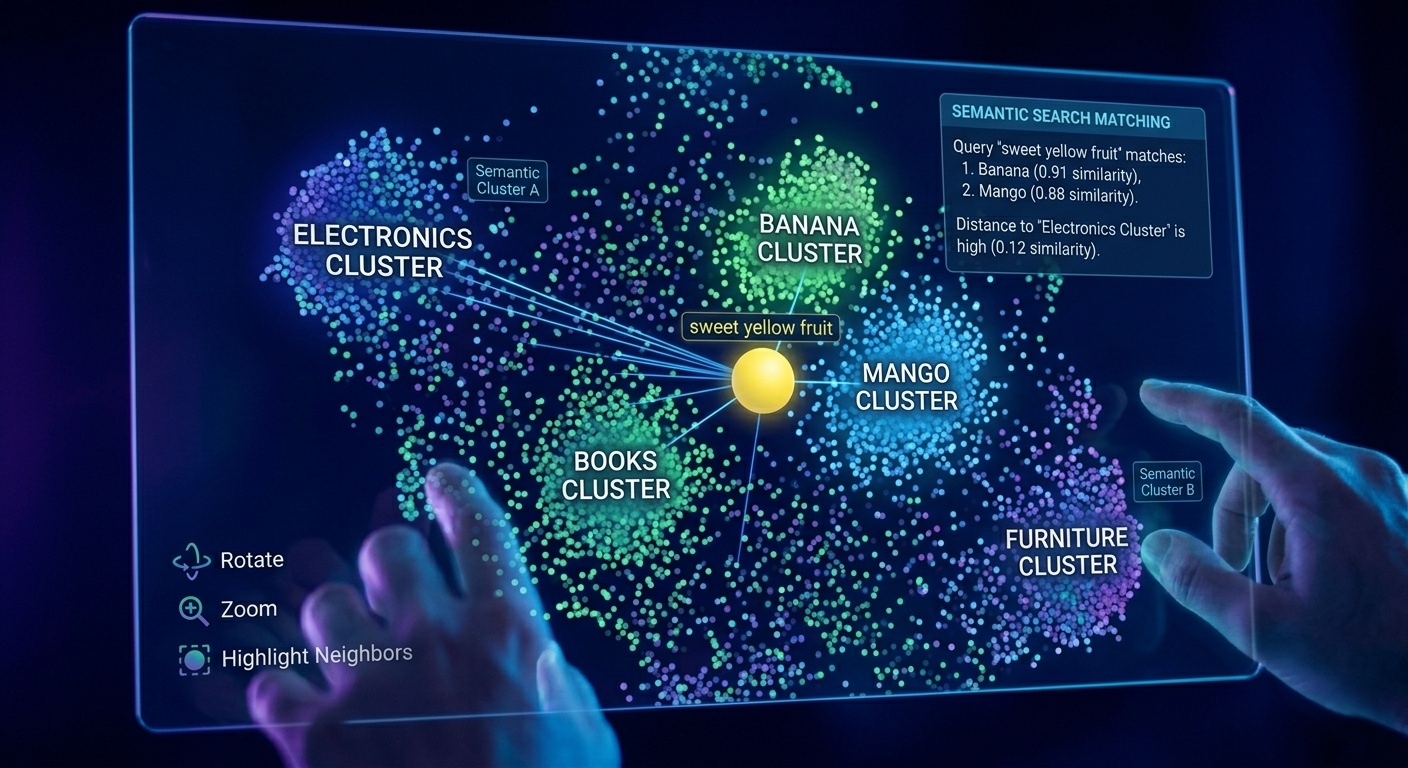
Imagine vectors for fruits:
- Apple
- Banana
- Mango
- Laptop
- Keyboard
After PCA:
- Fruits cluster together
- Electronics cluster separately
Now query:
sweet yellow fruitThe query point lands near:
- Banana
- Mango
This visually confirms semantic understanding.
Technologies to Build This
Backend
- Python
- FastAPI / Flask
- Scikit-learn (PCA)
- NumPy
- FAISS / Chroma / Pinecone
Frontend
- React
- Three.js
- Plotly.js
- D3.js
- Recharts
Embeddings
- OpenAI
- Hugging Face Models
- Gemini Embeddings
- Sentence Transformers
Suggested Features
Interactive Controls
- Rotate graph
- Zoom
- Hover labels
- Highlight nearest neighbors
- Search item name
- Change color by category
Comparison Mode
Show side-by-side PCA graphs for two embedding models.
Time Evolution
See how vectors move after retraining.
Challenges
PCA Limitations
PCA is linear reduction. Sometimes semantic relationships are nonlinear.
Alternatives:
- t-SNE
- UMAP
But PCA is fast, explainable, and ideal for first-level visualization.
Future Possibilities
Vector Visualization can evolve into:
- AI debugging dashboards
- RAG observability tools
- Search quality analytics
- Recommendation explainability systems
- Live embedding monitors
Final Thought
Embeddings power modern AI, but they are hidden in mathematical space.
Vector Visualization turns that hidden intelligence into something humans can see, inspect, and improve.
Instead of trusting similarity scores blindly, we can now observe meaning spatially.
Tagline
"If embeddings are the language of AI, Vector Visualization is how humans read it."
Conclusion
This concept bridges the gap between machine representation and human understanding.
By combining:
- Embeddings
- PCA
- 3D Visualization
- Query Mapping
We create a transparent and powerful system for analyzing vector quality.